Track your business and personal expenses with ease using this free comprehensive Expense Report Template tailored for Google Sheets. Whether you’re managing finances for small businesses or looking to streamline your personal budget, this template is your ally in maintaining a clear financial trajectory.
Hello and welcome!
If you’ve been following my Before You Invest guide, one of the topics I talk about is the importance of tracking your expenses so that you can identify your spending habits, cut unnecessary costs and direct the excess into investments.
That’s exactly what this post exists for – to give you access to a handy tool that allows you to do exactly just that – track your expenses.
In this post, I’ll give you access to a Personal Finance Spreadsheet and Budgeting Spreadsheet as a means to say thanks for reading my content and supporting my site.
The Expense Report Template: A Brief Overview
I was fed up with scouring the internet to try to find a personal finance spreadsheet that was intuitive, useful, and visually appealing – so I went ahead and created my own.
The purpose of my personal finance spreadsheet is to enable you to forecast your expenses over a specific period and track your actual expenses.
This spreadsheet has been designed so that you can simply make a copy of it multiple times and use it for different periods.
For example, if you wanted to track your expenses each month, then you can simply make a new copy of the template for each new month.
However, if you’re lazy like me, then you can also use it to forecast your annual expenses to help get an approximate understanding of how much you save each year.
I like doing it this way because my main source of income is still my standard job, so forecasting my annual expenses makes it easier to compare with my annual income.
The cool thing is that not only does it tally up all your expenses and give you your annual expense forecast, it also breaks down your expenses into daily, weekly, fortnightly, monthly, quarterly, and biannually amounts, so you can assess how much you are spending for different time periods.
When I was making the template, my main goal was to make it as user-friendly and useful as possible. That’s why I built in the functionality to define your expenses in different ways.
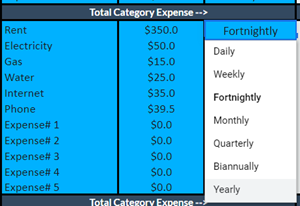
For every expense item you define, you enter the amount as well as the period over which the expense occurred. I made it so you can select the time period from a dropdown list. I did this because often our expenses are reoccurring over a specific time period, like rent for example which I pay fortnightly.
I did this to take all the grunt work out on your end – you don’t have to worry about doing the conversions from weekly to monthly, or quarterly to fortnightly etc. Instead, it does this automatically based off the period you define!
You can download my Personal Finance Spreadsheet below. The rest of this post goes into more detail about how to use the sheet, but instructions are also contained within the spreadsheet itself, so if you’re eager to jump right in, then you will have all the information you need inside the spreadsheet itself!
How My Personal Finance Spreadsheet Works
There are two main parts to my personal finace spreadsheet. These include the ‘Expense Forecaster’ sheet and the ‘Actual Expenses’ sheet.
Starting with the ‘Expense Forecaster’, there are three main parts to it. These include:
- Defining your income
- Defining your expenses
- Evaluating your savings
Basically, the way it works is that you work from top to bottom of the spreadsheet, starting off with your income.
You define your income by entering your income amount (as well as the amount you pay in tax if you want to get a better approximation of how much you save after expenses).
The sheet will then automatically calculate your after-tax income. This will be used later on to automatically calculate your savings rate, once all your expenses have been defined!

Once you’ve defined your income, you then move on to defining your expenses.

When defining your income and expenses, theres a couple of important instructions to follow. To provide a summary, let’s look into what each of the headers, or columns means in my tracker template.
First and foremost though, you only have to edit the cells that are coloured in blue, the rest is done automatically for you!
Headers/Columns Explained
Expense Category
I have structured the personal finance spreadsheet template into segments called Expense Categories. Since our expenses stem from a wide range of sources, I wanted to be able to capture these sources so that I could pinpoint where my money is being spent.
An Expense Category could be something like Utilities, Transport or Loans. You then allocate expenses to each category to assess the total amount you spend on each category.
Expense Items
These are the expense items you define that fit within an expense category. For example, under utilities, common expense items that you would add would be Rent, Bills (Electricity, Gas, Water, Internet) etc.
Expense Amount
For each expense item you define, the expense amount column is where you enter the actual dollar value of each of your expenses.
Expense Period
Each expense item you define may occur over different time periods, so the Expense Period column allows you to define that period.

For example, my rent is taken out every fortnight, so next to my expense amount for my rent item, I would select the ‘Fortnightly’ option from the dropdown list.
Similarly, another expense of mine is my car insurance, which I have to pay once annually. So in this case, rather than selecting ‘Fortnightly’, I would define the Expense Period as ‘Annually’, since this expense is only paid once yearly.
Daily, Weekly, Fortnightly, Monthly, Quarterly, Biannually and Annually
The headers denoted by the Daily through to Yearly columns are added to convert the expense items you defined into the expense amount applied to the respective time periods.
It automatically converts the expense item into different costs per time period.
For example, if you define your rent as a fortnightly expense, you may be interested to see how much that is costing you bi-annually, or yearly for example.
That’s why these headers exist, they take each expense item you define and convert them into an expense over different periods. For example, a $350 fortnightly rent payment costs $4,550 over a 6-month (biannual) period, or $9,100 over a 12-month (annual) period.
This gives you better coverage of your expenses and how much it is costing you over different time periods.
The row below each of these daily through to yearly headers further sums up the total expenses for each category over each time period.
For example, you can see how much your total utility expenses are over a daily through to yearly time range.
Item (%) Contribution To Category Expense
This column takes your expense items within each category and gives you the percentage that each expense item is contributing towards the total category expense.
For example, my $350 fortnightly rent payment accounts for 77.3% of my total Utility expenses.
Category (%) Contribution To Total Expense
This column is similar to the previous, but instead calculates the percentage that each expense category is contributing towards your total expenses.
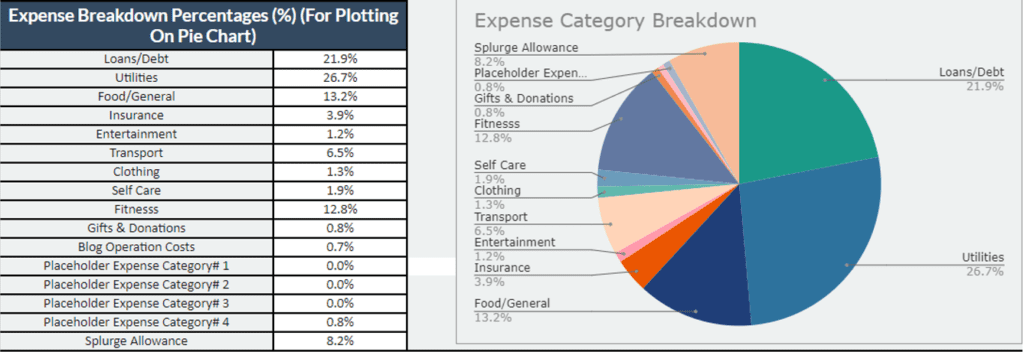
For example, in the above example, the Utilities expense category accounts for 26.7% of my total expenses.
Evaluate Your Savings Rate
Once you have defined your income and all of your expenses, the spreadsheet will look at these and perform a calculation to determine your savings rate.

This number tells you, in a percentage, how much of your income you are saving after all your expenses have been accounted for.
The row with the entry ‘Total Saved (For Each Period)’, also shows you the dollar amount of your savings (less expenses) over each period. For example, if your total annual expenses are $39,192.6 and your total after-tax income is $60,158.3, then you will have saved $20,956.7, which equates to a savings rate of 34.9%.
Tracking Your Actual Expenses
The ‘Expense Forecaster’ sheet is great for forecasting your average expenses over a specific time period. However, sometimes our expenses change on a month-to-month basis, so trying to ‘forecast’ out a single figure may not be enough.
That’s exactly why I built the ‘Actual Expenses’ sheet into my Personal Finance Spreadsheet.
This sheet allows you to itemise each of your actual expenses over a monthly time period.
This means you can make a copy of the sheet for each new month to calculate your actual expense amount for each month.
I’ve built it so that you can then compare it against your forecasted amount, which is defined from the previous ‘Expense Forecaster’ sheet.
With the ‘Actual Expenses’ sheet, each time you make a transaction, or an expense, you can input it into the sheet as a new expense item.
If you continue to do this for the full month, the sheet will tally up your total actual expenses, so you can track how much you’ve actually spent.
Each time you input an expense, all you need to do is define:
- Expense item – here, you input the name of the expense
- Allocate to Expense Category – here, you select which category the expense belongs to. The categories you can choose from depend on the categories you define in the ‘Expense Forecaster’.
- Expense Amount – here, you define how much the expense item costed you
- Date of Expense – here, you enter the date that the expense was made
- Expense period – here, you define the expense period. For example, if you’re individually tracking every expense for each month, then you would select the expense period as ‘Monthly’. However, say you paid rent fortnightly, then you could instead enter this with an expense of ‘Bi-weekly’.
I’ve built the spreadsheet with a default number of 100 expense items you can define. If you don’t need all of them, then just leave them blank so it doesn’t affect the automated calculations!
You can also define your actual income for a specific month to get your actual savings rate. This is compared against the forecasted savings rate you calculated earlier.
Other Useful Features
Pie Chart
Another useful feature included in the ‘Expense Forecaster’ sheet is a breakdown of all your expense categories and their overall contribution to your total forecasted expenses, shown as a percentage on a pie chart. This is a great way to see which expense categories are contributing the most towards your total expenses, which may help you identify where you can cut costs!

Compound Interest Calculator
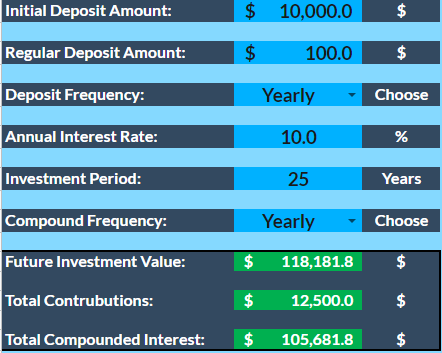
I’ve also built a compound interest calculator into a separate sheet within the Tracker Template.
You can use this compound interest calculator to see how quickly your savings can grow. It helps you work out:
- what money you’ll have if you save a regular amount
- how compounding increases your savings interest

If you want to learn exactly how to use this tool, check out a previous post of mine which details all the inputs!
See my post here: Project The Growth And Future Value Of Your Money Over Time
Get Started With The Personal Finance Spreadsheet
Now that you have an overview of how the Personal Finance Spreadsheet works, access it today for free by entering your name and email address!
You will receive a link to a Google Spreadsheet containing the template, and you’ll be able to access it immediately after!
If you still need guidance on how to operate and work my spreadsheet, be sure to check the ‘Instructions’ sheet contained within the Google Sheet to step you through the process!
If after that you still need assistance, I’ve also included an email address at the bottom of the ‘Instructions’ sheet, so just send me an email with any questions you have – I’m happy to help!
Best of luck,
– Nate


